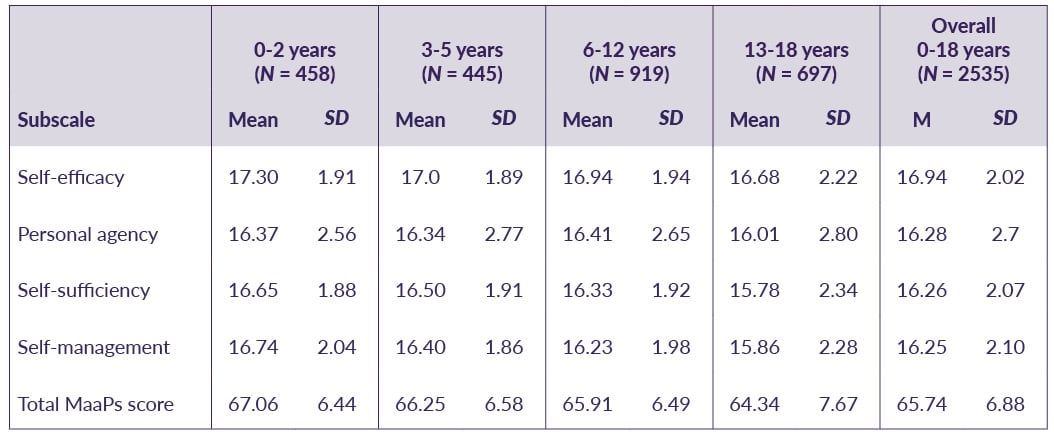
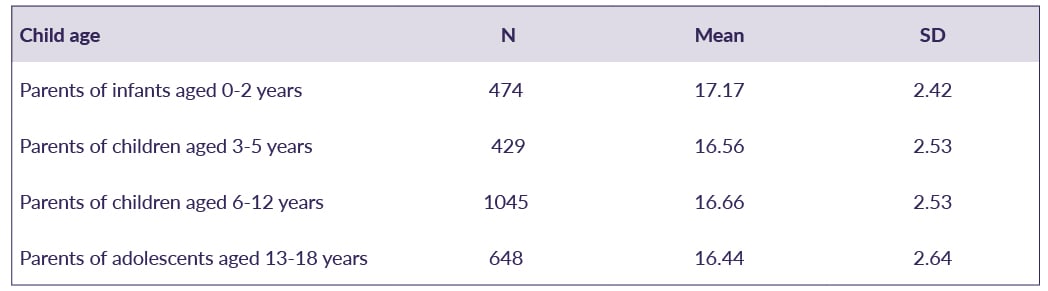
Based on a representative sample of Australian parents living in Victoria, Australia, in 2016 (N = 2535). Table 1 shows average scores on the MaaPs for a representative sample of Australian parents, depicting population norms (average) and standard deviations for parents of 0 to 2-year-olds, 3 to 5-year-olds, 6 to 12-year-olds, and parents of adolescents aged 13-18 years.
Table 1. MaaPs means and standard deviations in an Australian sample
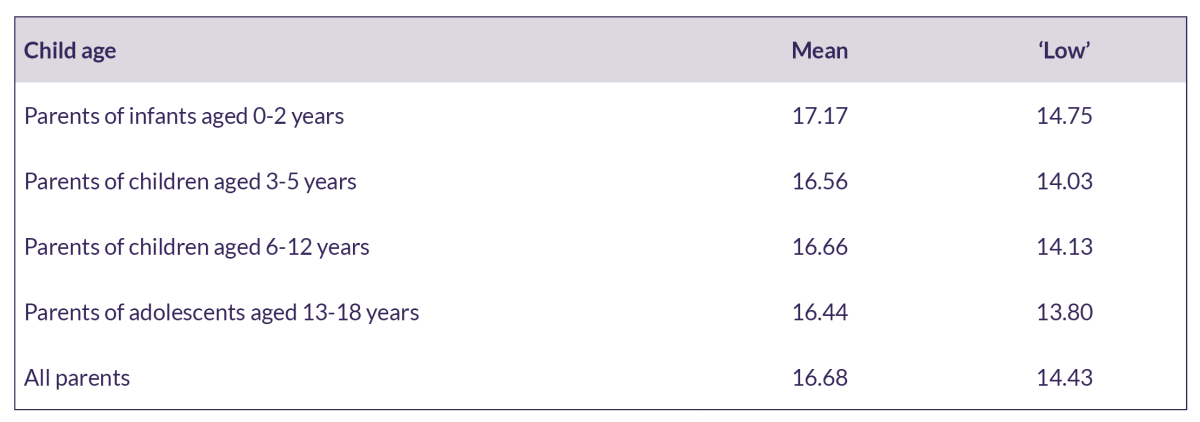
Scores that are one standard deviation or more below the population mean may be viewed as a ‘low’ score and an indication that a parent has a lower than average perception of their parenting self-regulation compared to other parents. Table 2 depicts average and ‘low’ scores for parents by child age, while Table 3 depicts average and ‘low’ scores on parenting self-regulation subscales.
Table 2. Total MaaPs scores – mean (average) and ‘low’ scores
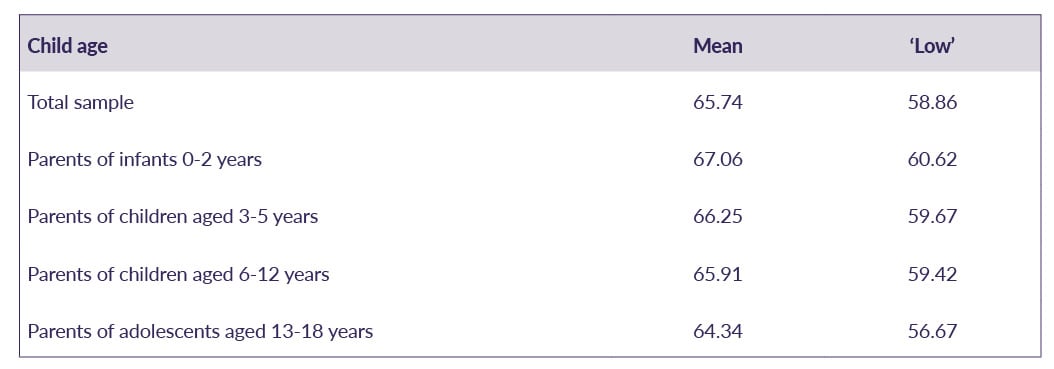
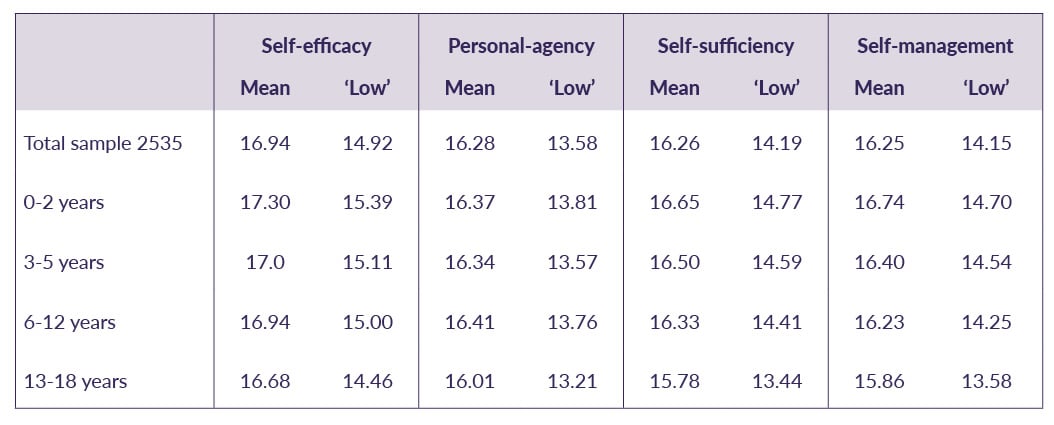
Table 3. MaaPs subscale scores – mean (average) and ‘low’ scores

 Scores that are one standard deviation or more below the population mean may be viewed as a ‘low’ score, and an indication that a parent has a less than average perception of their parenting self-efficacy compared to other parents. Table 2 shows average and ‘low’ scores on parenting self-efficacy.